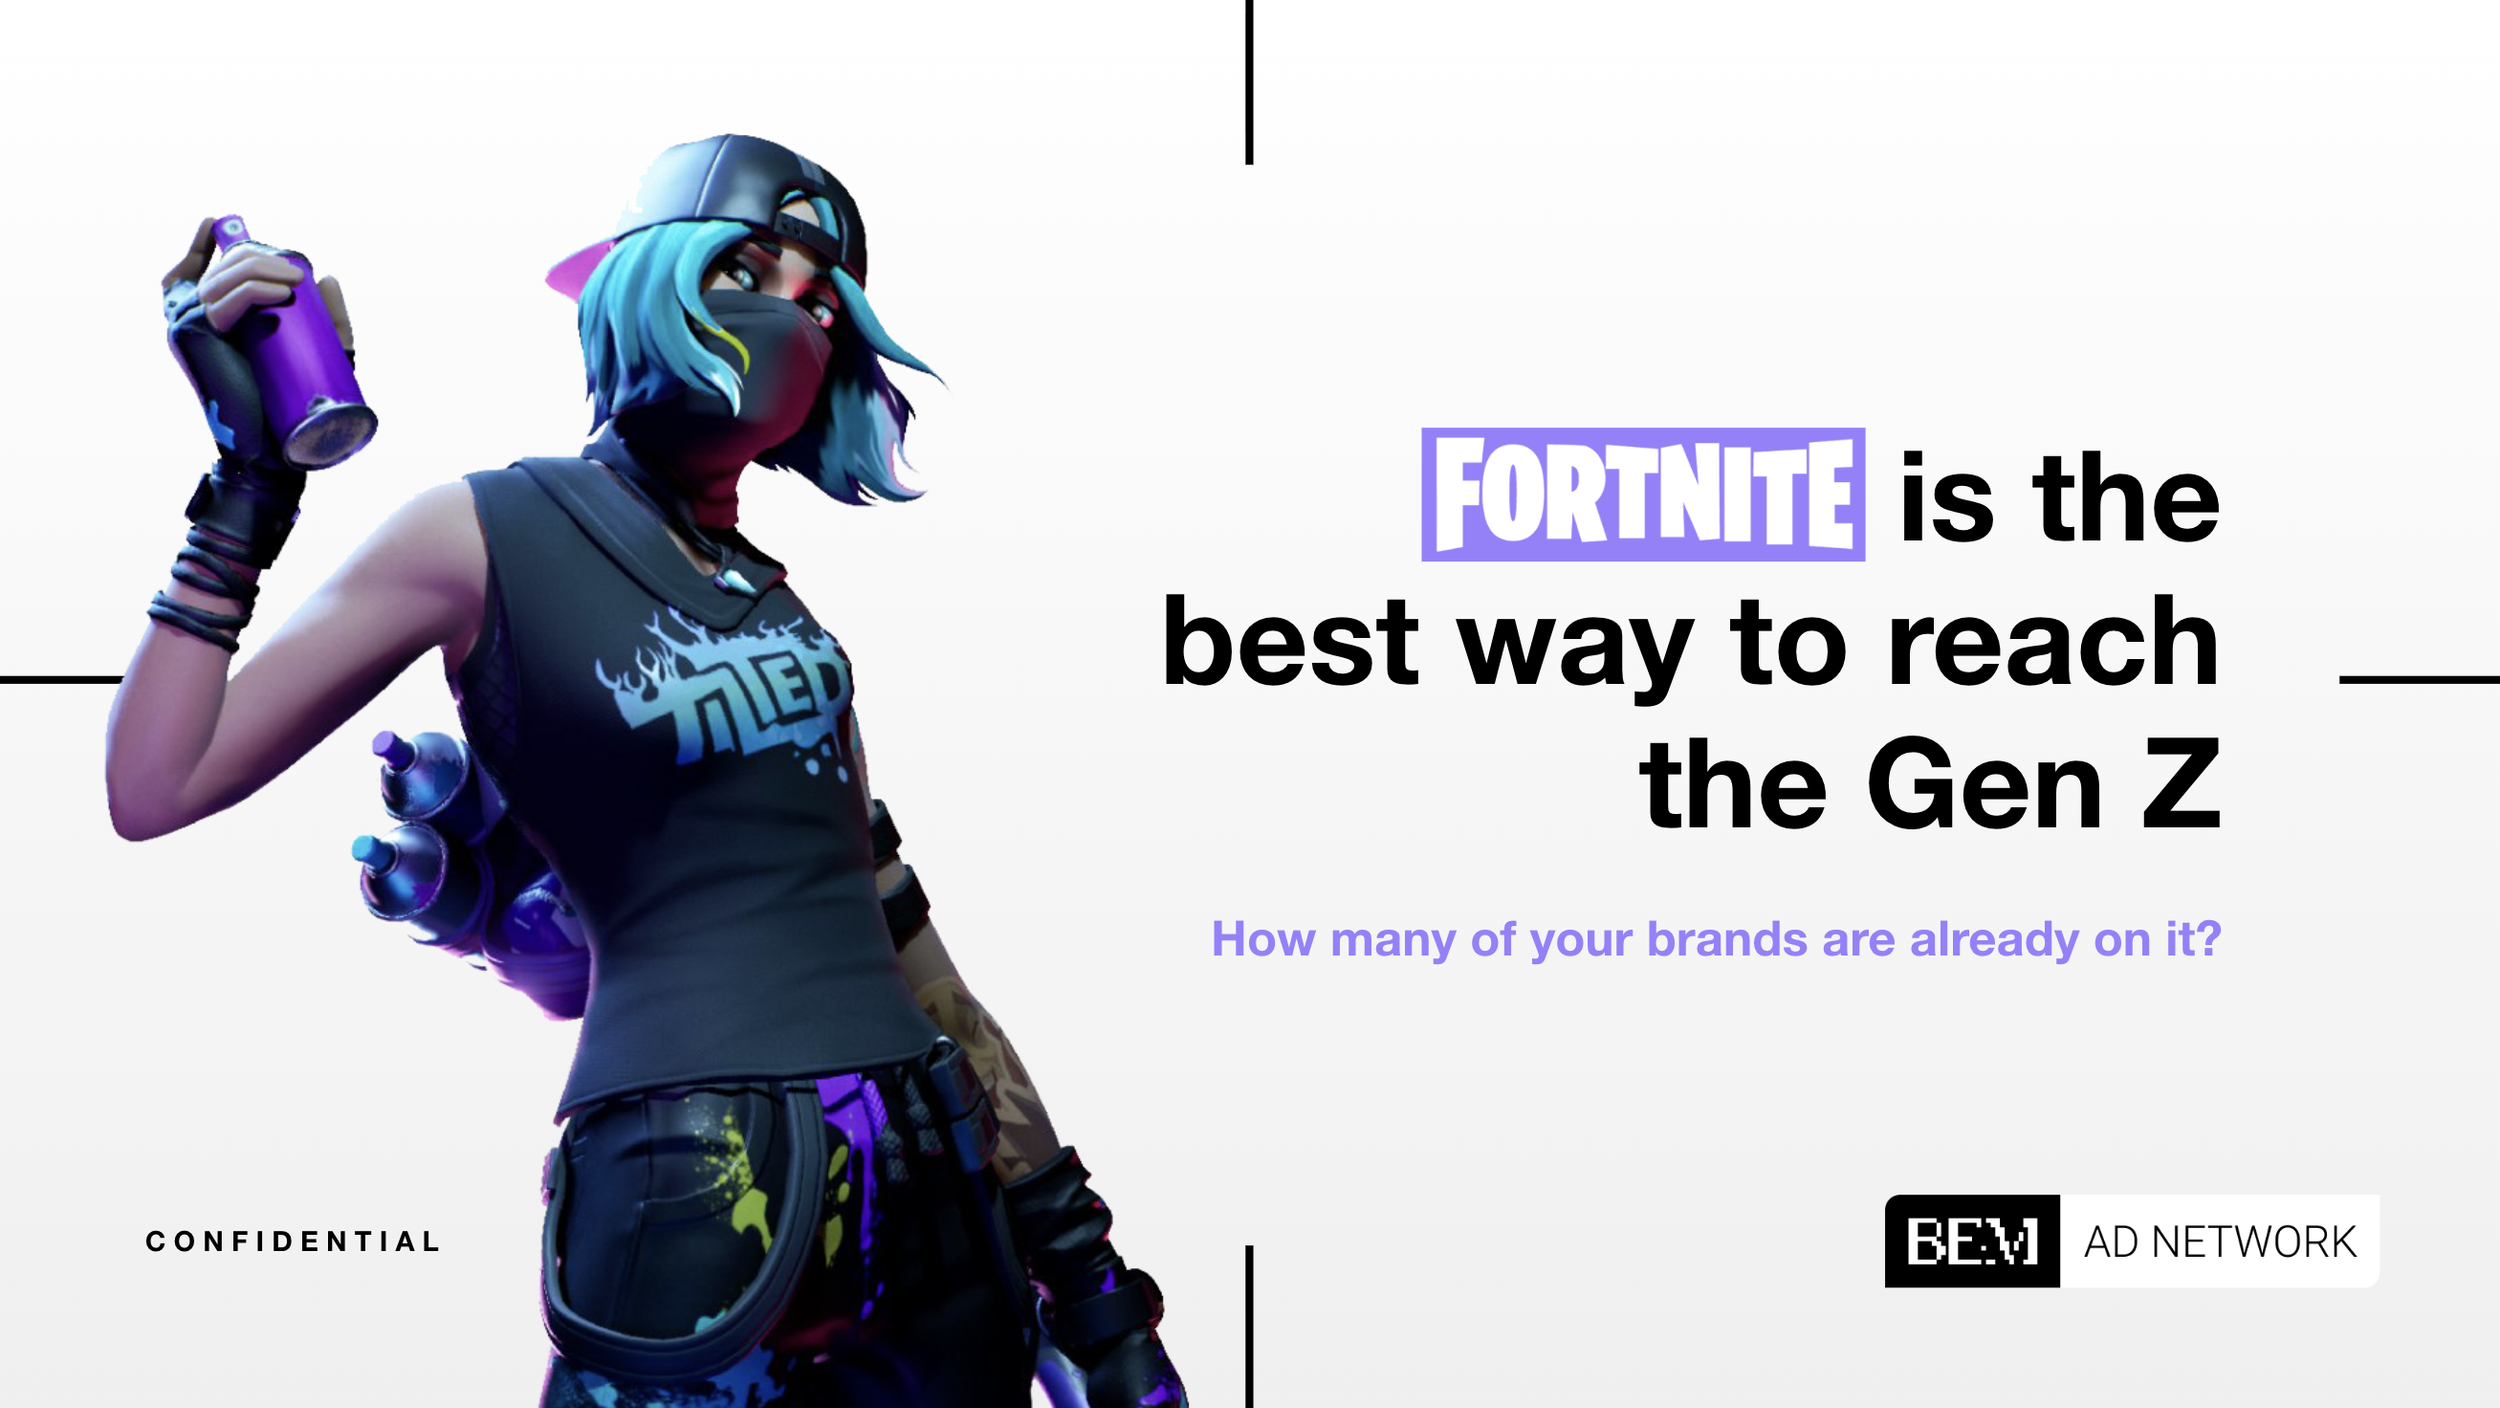
A promotional graphic featuring a female Fortnite character with blue hair, wearing a black tank top and baseball cap, holding a purple spray can. The text on the image reads 'Fortnite is the best way to reach the Gen Z,' with additional smaller text 'How many of your brands are already on it?' and a logo 'BEM' at the bottom right corner.
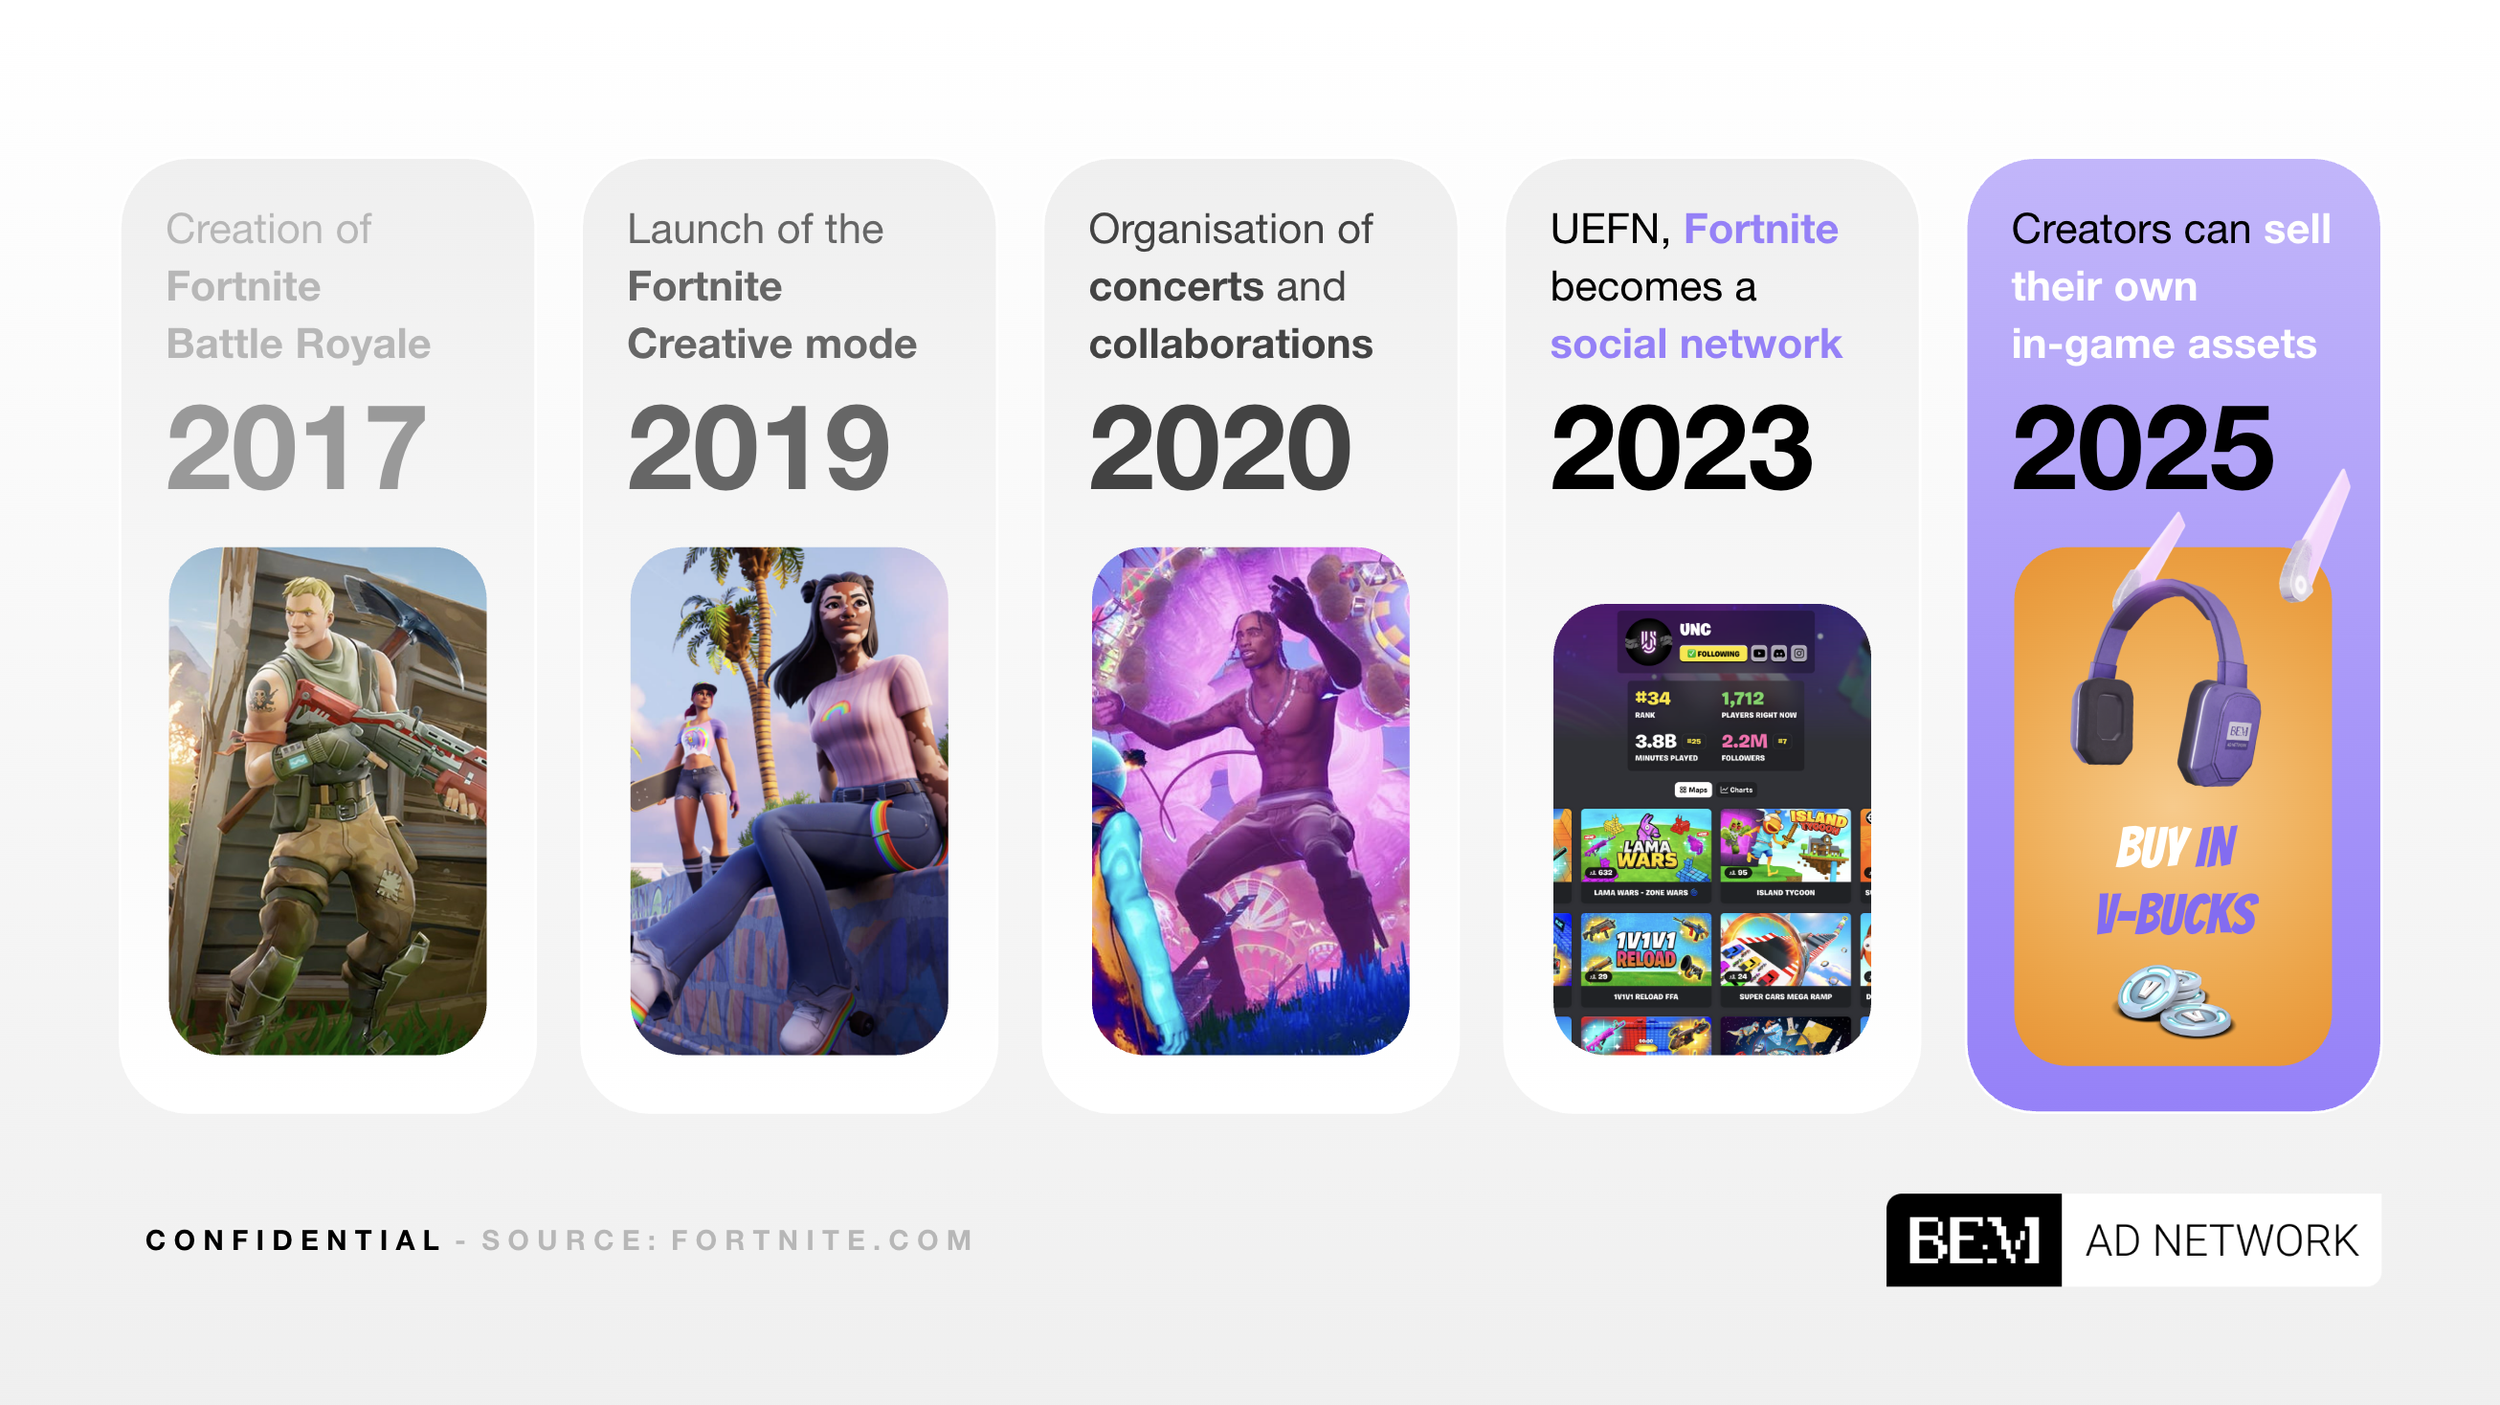
Timeline showing the evolution of Fortnite from 2017 to 2025 with images representing each year, including Fortnite Battle Royale gameplay in 2017, creative mode in 2019, concerts in 2020, social network features in 2023, and creators selling in-game assets in 2025.
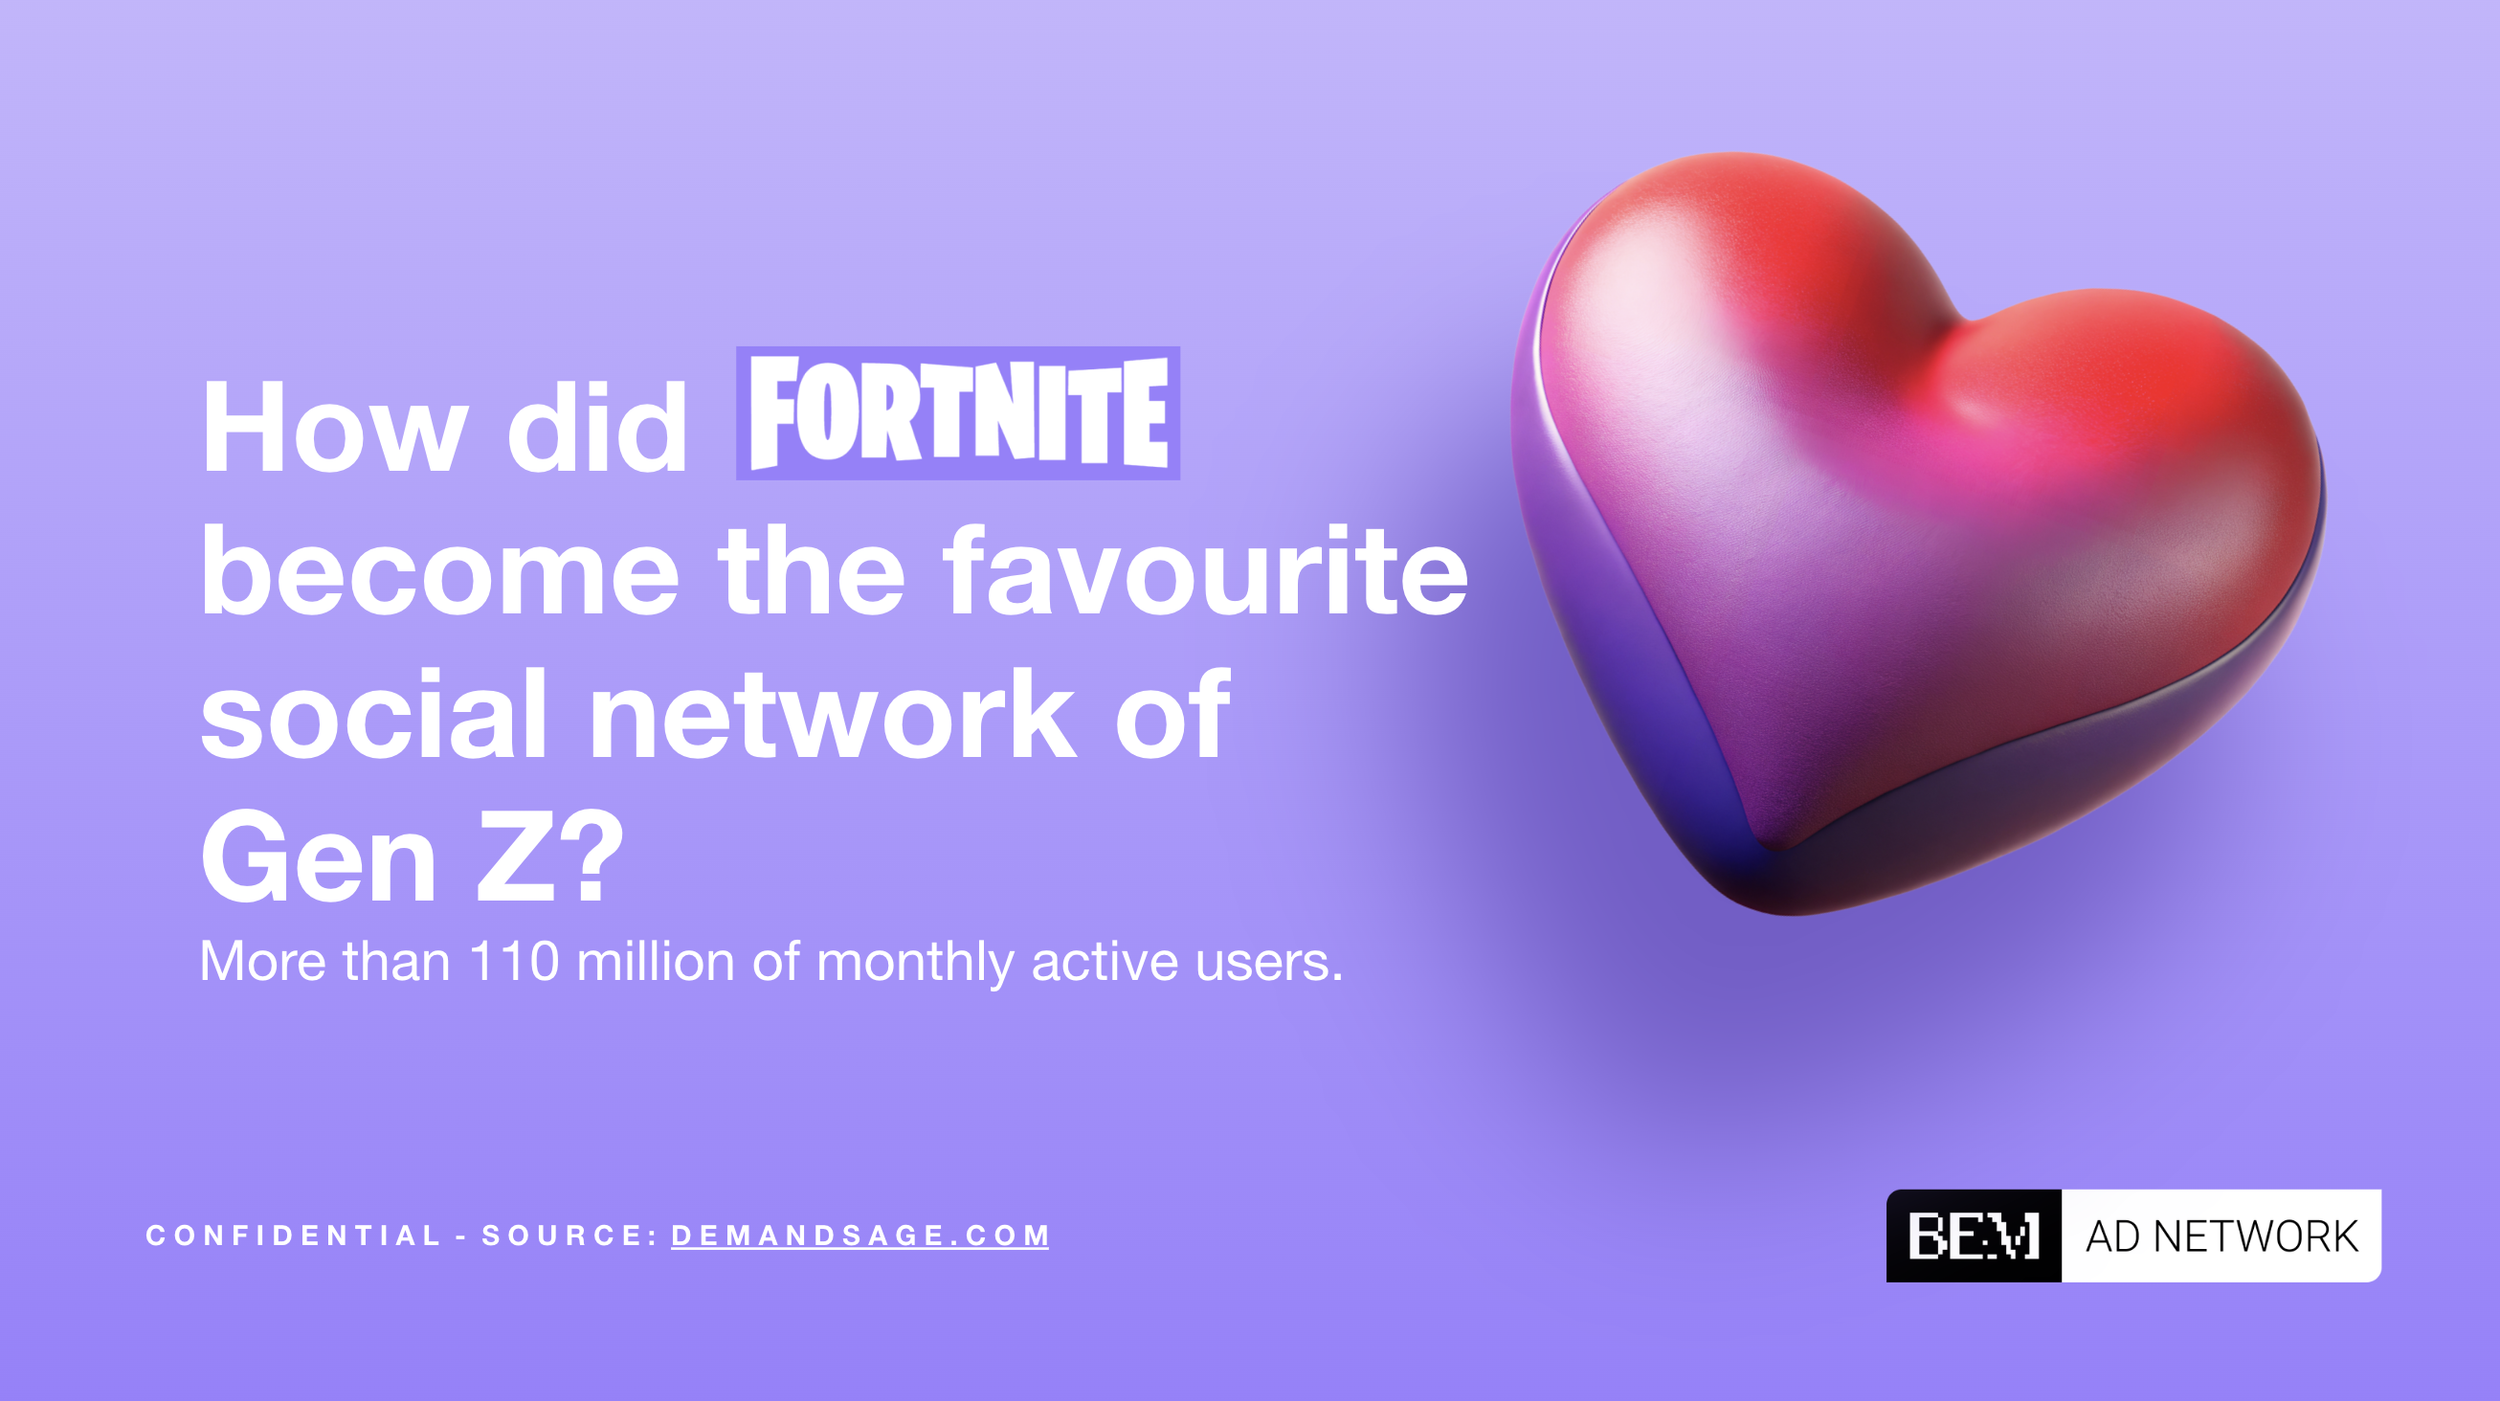
A colorful image featuring characters and elements from Fortnite, including characters with weapons, vehicles, and a shopping cart, with overlaid text about Fortnite user statistics.
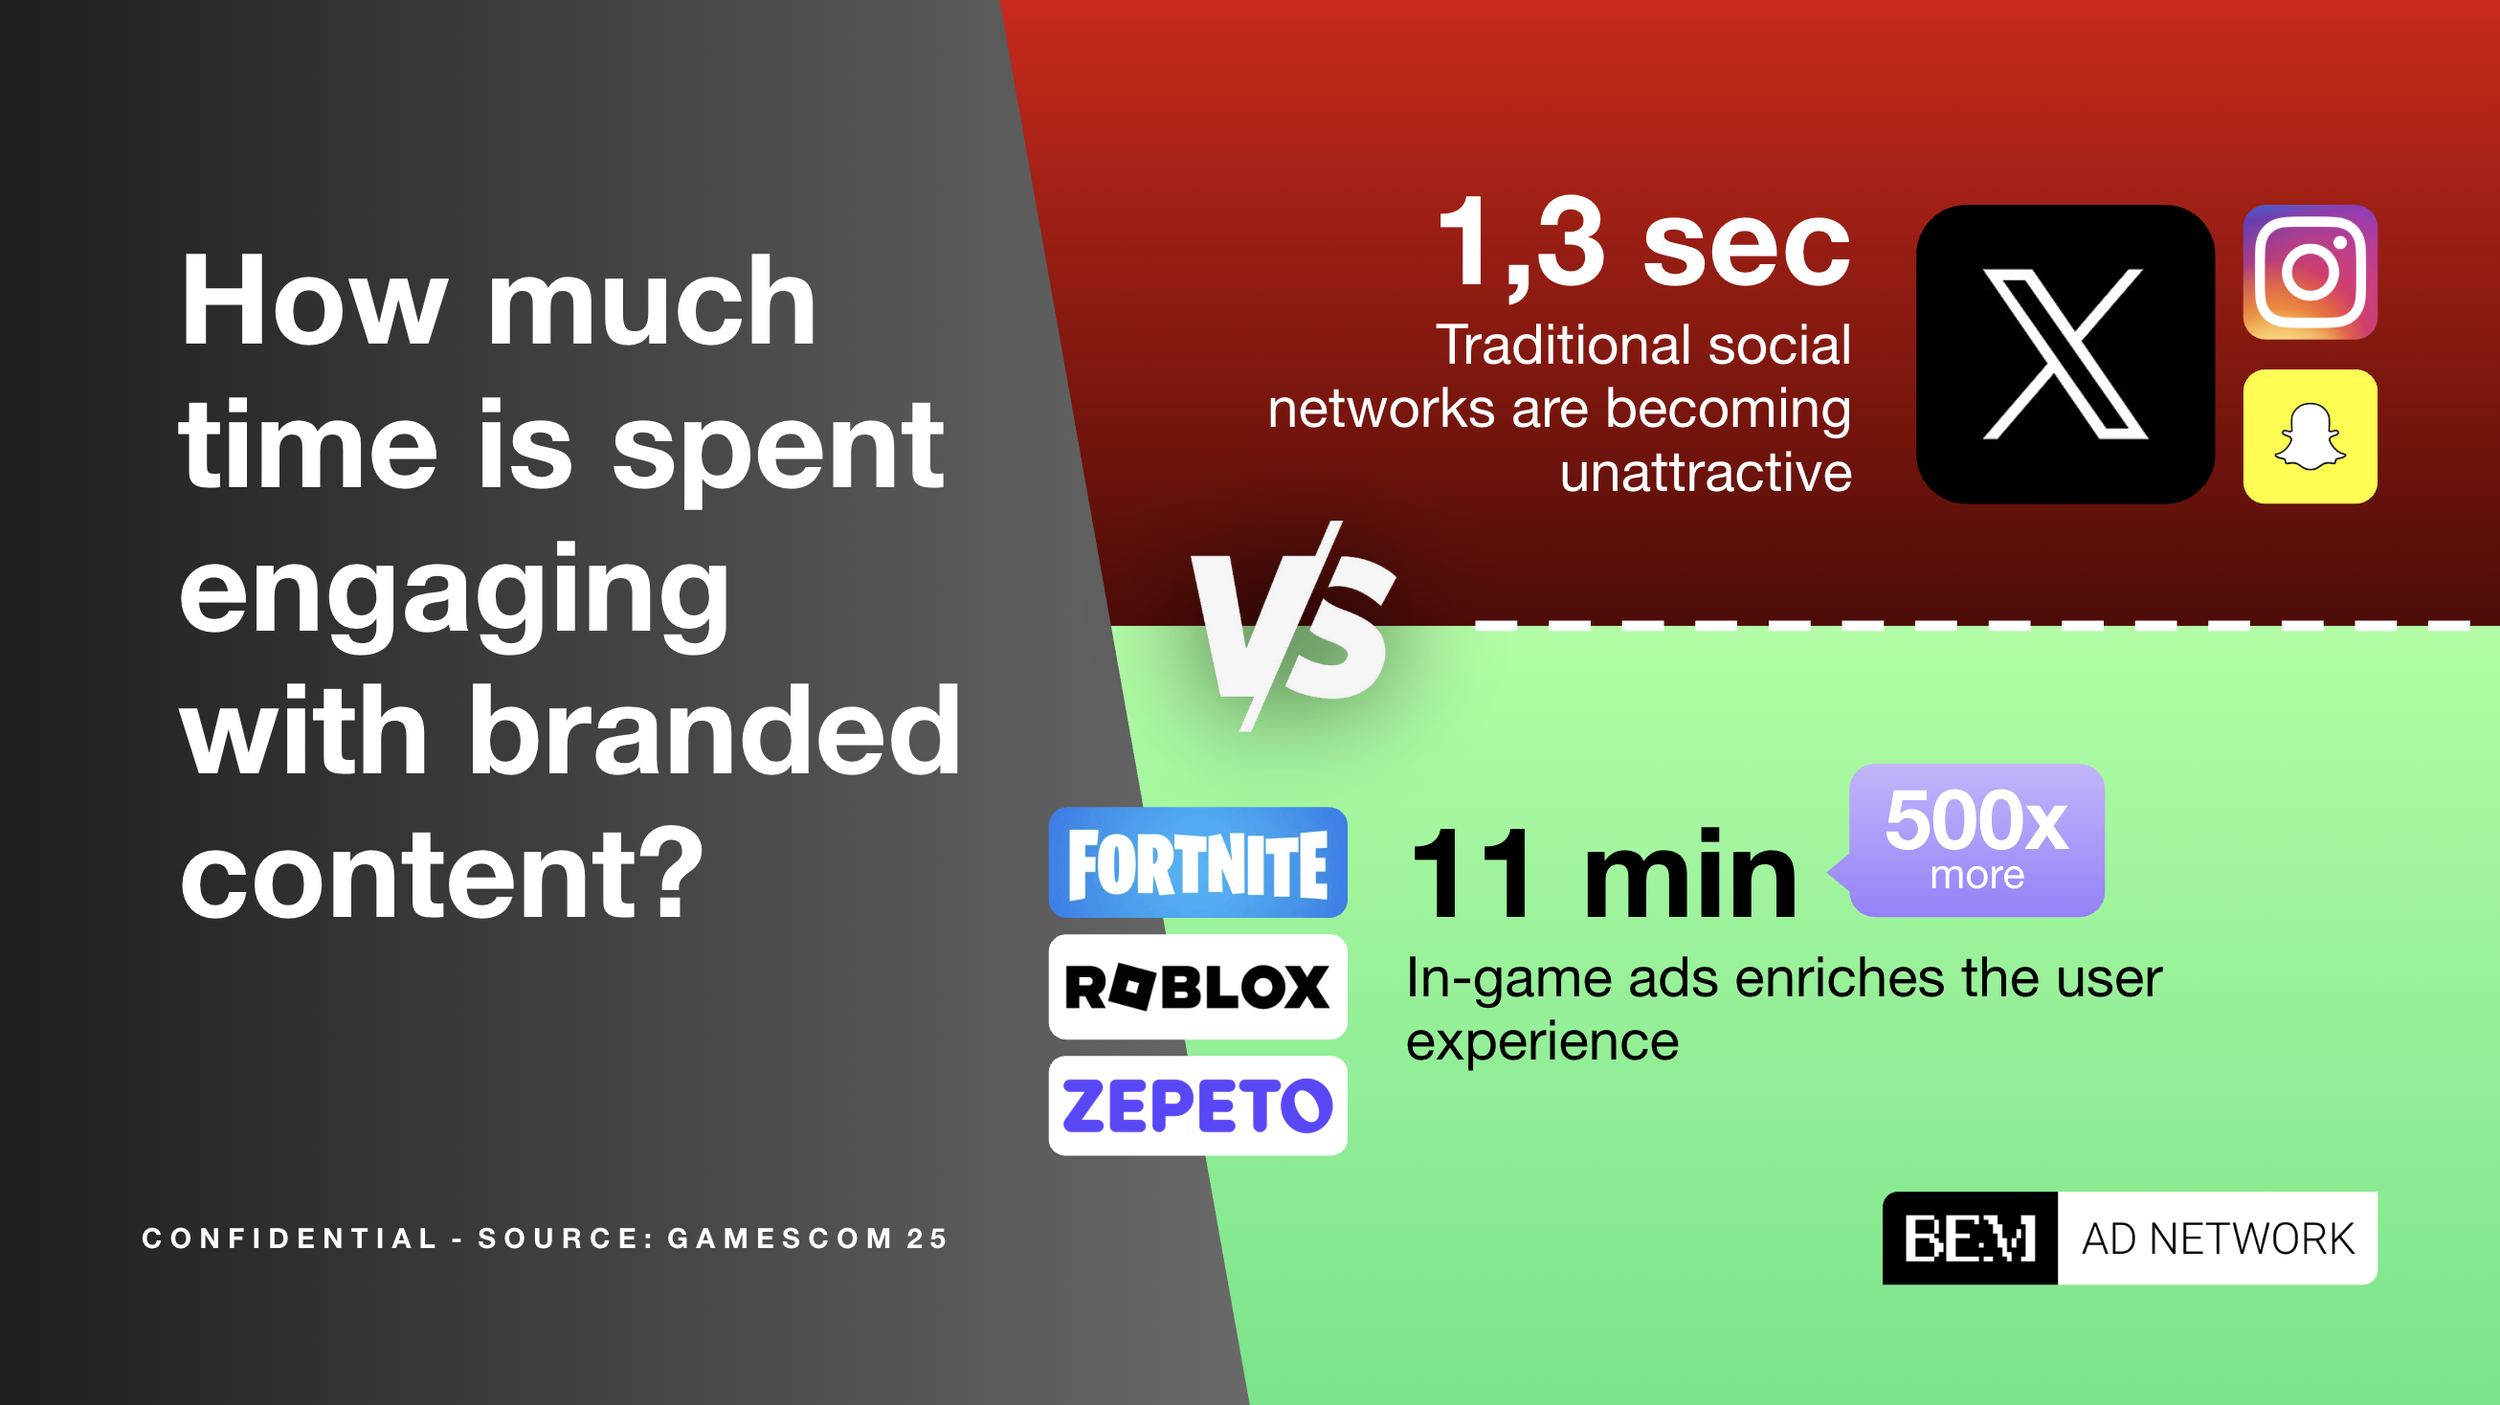
Comparison chart on social media engagement time: Traditional social networks are becoming unattractive, taking 1.3 seconds, whereas gaming ads like Fortnite, Roblox, and Zepeto can engage users for 11 minutes or more, with in-game ads enriching the user experience.
Text and images in an infographic listing 270 brands across fashion, beauty, and cosmetics sectors. The brands include Fortnite, Armani Beauty, Fenty Beauty, Nike, Ralph Lauren, and others, with visuals of makeup products, fashion models, and gaming characters.
Comparison of two maps: the first map shows a colorful amusement park with people enjoying water rides, labeled 'Before, brands created their own maps'; the second map is a Fortnite-themed map with players and logos, labeled 'Now, brands are integrated into popular maps'.
A digital marketing pricing chart displaying costs for different advertising formats, including billboard, NPC, wearable, radio box, object 3D, and survey, with descriptions of features and benefits.
An infographic titled '3 key points to match with THE MATH,' divided into three sections: 1) Golden Rules with a screenshot of a map interface; 2) MMMs & ROI with icons of gaming, social media, and Snapchat; 3) Cross-channel measurement with campaign analytics and KPI metrics. The infographic explains strategies for marketing and social media analytics.
A rate card for 2025 displaying quarterly rebate schedule prices for different advertising formats, including billboard, asset 3D, radio box, wearable, NPC, and survey, with pricing based on purchase volume and a small animated character dressed as a gardener in the top right corner.
A group of stylized animated characters in a colorful outdoor setting with palm trees, a streetlamp, and kites flying in the sky. There is a woman with dark hair and a rainbow sticker on her shirt sitting on a ledge, and a purple creature holding a device. A QR code is prominently displayed in the center with a hand icon pointing at it, and there are informational text and logos at the bottom.